This is the fourth of a series of posts looking at each of the different visualization types created for the MeSch museum post-visit visualization tool. Click here for overview.
The bubbles visualisation is an abstract interactive illustration. A personalised character (similar to the personalised character detailed here) sits at the centre of a number of rings of bubbles (discs).
The number of rings is determined by how many perspectives were available at the physical exhibition. For example at the Atlantikwall exhibition in Museon in Den Haag it was possible to experience the offering from one of 3 perspective; a German soldier, a civilian and/or a civil servant. Therefore the bubbles visualisation for this will have 3 rings of bubbles.
Each bubble then represents each available point of interest for each perspective. Each ring is a different color. In addition the opacity of each bubble is determined by whether the visitor has experienced the point of interest during their physical visit or not. Bubbles with a higher contrast represent those points the museum visitor has interacted with.
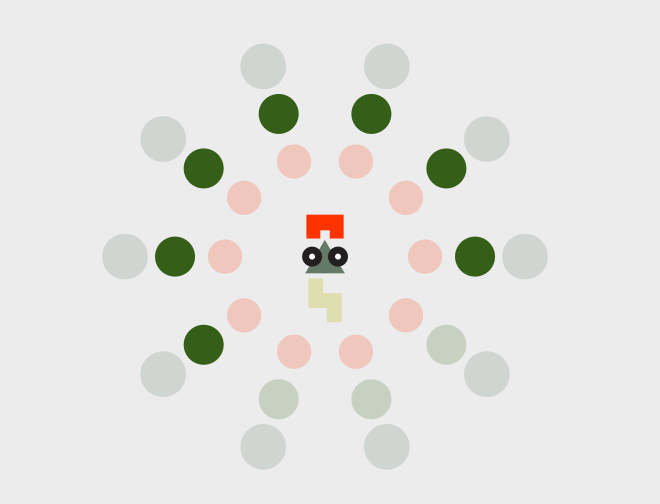
Bubbles visualisation for Atlantikwall exhibition at Museon, Den Haag, The Netherlands.
In the case of the Atlantikwall Exhibition above we have a very balanced visualisation. This is because each point of interest is available for each perspective. This visualisation is however heavily dependent on the exhibition model (how the curator decided to design the exhibition). In the case of the Forte Pozzacchio exhibition in Rovereto, Italy, where the points of interest are completely different for each perspective, we end up with a much different visualisation.
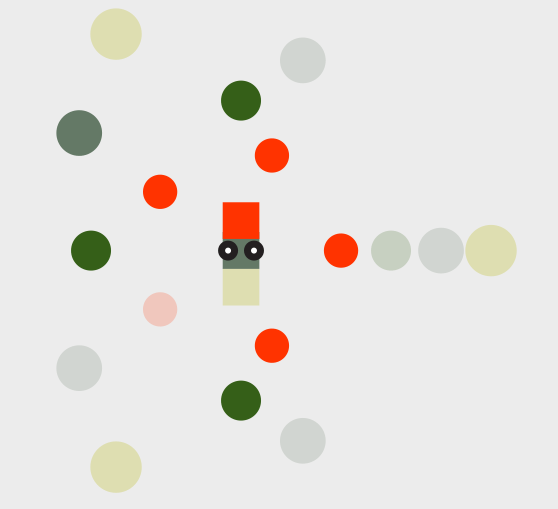
Bubbles visualisation for visit to Forte Pozzacchio exhibition in Rovereto, Italy
This reliance on the exhibition model creates a number of limitations for this type of visualisation. Most notably the amount of points it can display. Too many points of interest and the illustration (and interaction) becomes uncomfortable. An instance of this would be the Keys To Rome exhibition at Allard Pearson in Amsterdam (below) where each perspective had 24 points of interest.
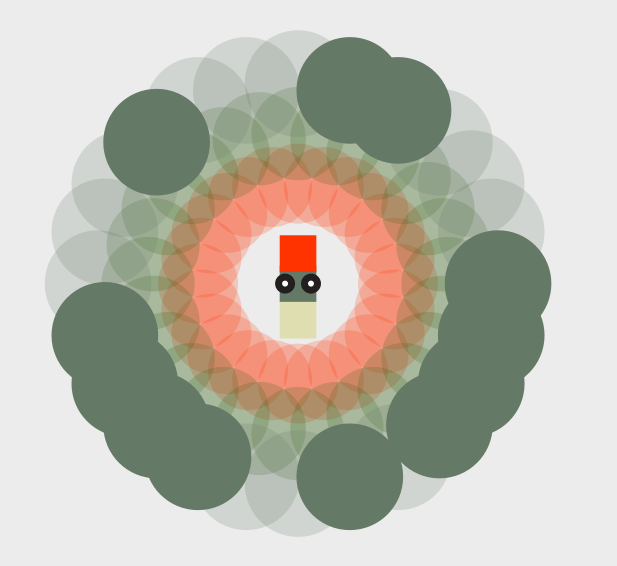
Bubbles visualisation for Keys To Rome exhibition at Allard Pierson Museum, Amsterdam, The Netherlands.
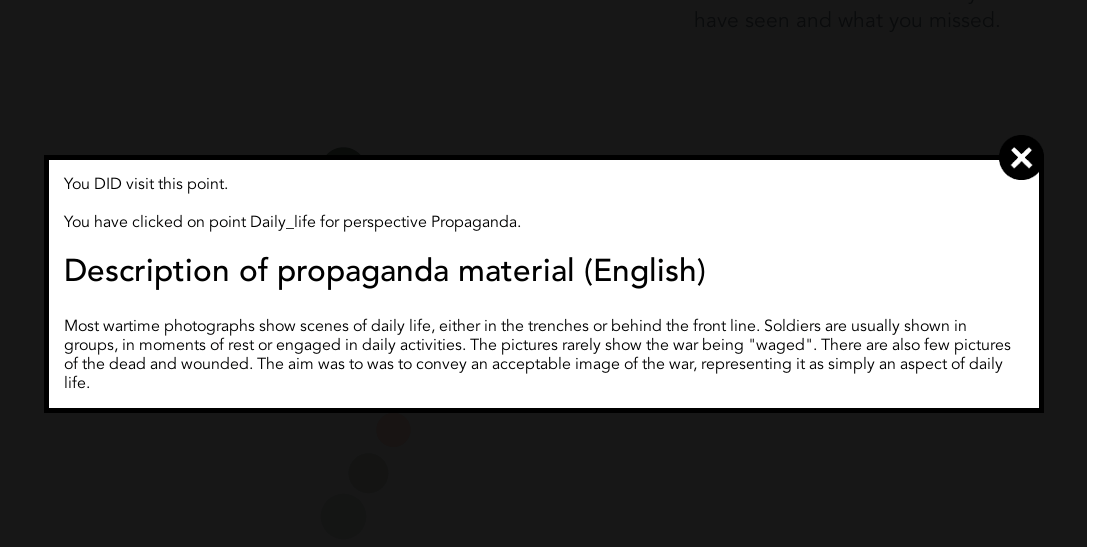
As part of the interactive nature of this particular visualisation clicking on a disk causes an overlay to display with content related to each point. The language the content is displayed in is based on the language the user viewed the real world exhibition in. Then content is taken from a separate web platform via API.
This implementation relies on the jQuery plugin colorbox and the JavaScript library d3.js. Code for the meSch implementation can be found here on bitbucket.