[Science, Technology, Engineering, Arts and Maths]
DollsMakingPatterns

Blythe helmet knitting pattern

Blythe helmet knitting pattern - ButterflyThis is another pattern that came about because I don't want to learn to crochet. All of the beautiful Blythe helmets I see online appear to be crocheted. Necessity is the mother of invention so here is a free pattern for a knitted version of a basic Blythe helmet...
Mara Shawl - Knitted - Finished
KnittingMaking

Mara Shawl

Knitted from Mara Shawl pattern. Used 2 balls of 4ply. The multicolored yarn is Donegal 4ply hand dyed yarn from The Old Piggery in a colour beautifully named Northern Lights.…
Simplicity 1506 Waistcoat - front
MakingSewing

Simplicity 1506 Waistcoat

Simplicity 1506 Waistcoat: Big and Tall Boy's and Men's Waistcoats Sewing Pattern. I made view B in Scottish tweed in size 2XL This is a very straight forward pattern. The only major change I made was with the interfacing. It seamed a bit odd to me that the pattern called for interfacing for the whole front of the piece. I considered that interfacing with tweed would make the waistcoat very stiff, so I left it out. I was very glad I did.
Magazine Visualisation
CodeData VisualizationsResearchTech

Magazine Visualisation

One of the outputs for the EU funded meSch project was a visualisation website. The Magazine Visualisation is one of the visualisations available on the meSch Post Visit Website. For information on how the meSch Post Visit Website works click here. The Curators at Museo della Guerra frequently create custom paper magazines to go with their exhibitions. Any exhibition might have multiple booklets, on different aspects of the same subject. For example, for an exhibition on WWI they might have 3 different books; the first on sanitary conditions, a second on daily fife and a third on the assault & bombing.
Photo album visualisation
CodeData VisualizationsResearch

Photo Album Visualisation

One of the outputs for the EU funded meSch project was a visualisation website. The Photo Album Visualisation is one of the visualisations available on the meSch Post Visit Website. For information on how the meSch Post Visit Website works click here. In short, during the physical visit the visitor checks-in at various exhibits using a physical item with an RFID card in it. The RFID logs the visit to a database. At the end of the visit the user gets a unique id, for example in the form of a printed postcard. They can use this ID to log in to the meSch Post Visit Website and see various visualisations based on their visit. This visualisation is a simple photo album. This visualisation is based on the HTML5 canvas flip book demo 20 Things I Learned. Each point of interest for the museum exhibition will have an image associated with it. This book displays all of these images and their titles.
Screenshot of a visitors passport showing stamps for each of the points they visited in the exhibition
CodeData VisualizationsResearch

Passbook Visualisation

This post looks at the tenth of the visualization types created for the MeSch museum post-visit visualization tool. Click here for overview. This visualisation was created exclusively for the Atlantikwall exhibition based on the stamps used on the physical postcard that exhibition visitors received.
Personalised Lego Character from Photo
CodeData VisualizationsResearch

Personalised Lego Character from Photo

This post looks at the ninth of the visualization types created for the MeSch museum post-visit visualization tool. Click here for overview. While investigating methods of creating personalised characters for online site users we explored the idea of using a photograph of a person to act as the basis for a Lego person.
Animal Path Visualisation
CodeData VisualizationsResearch

Animal Path Visualisation

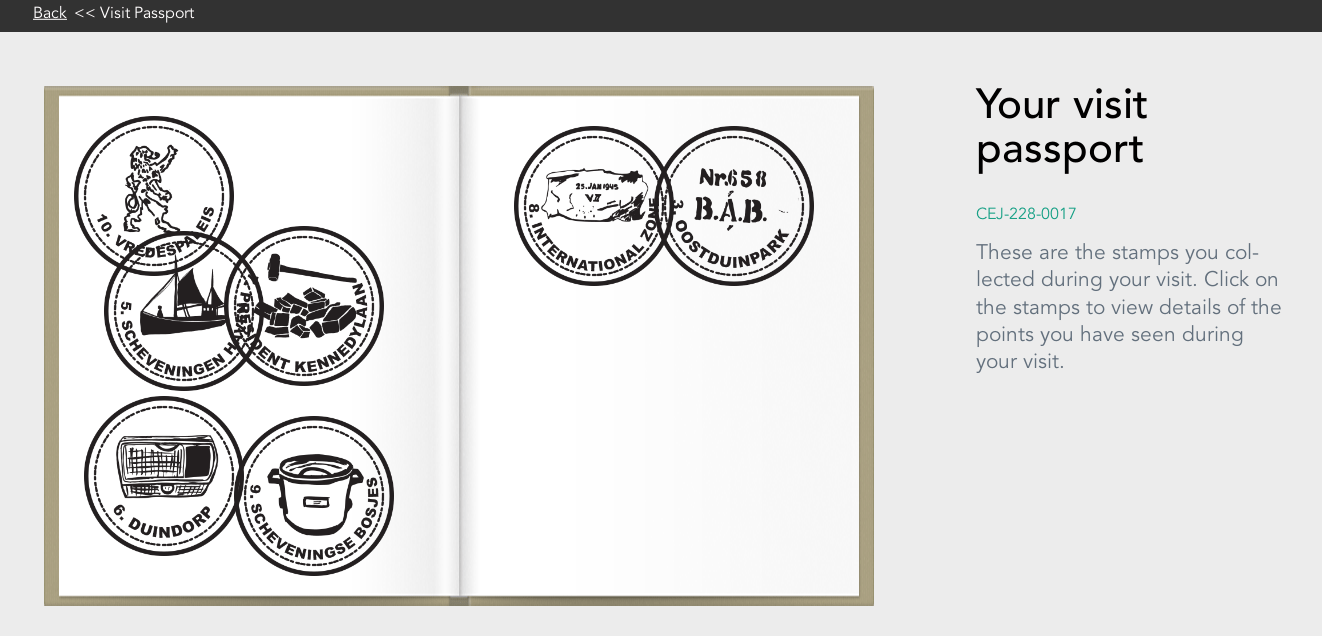
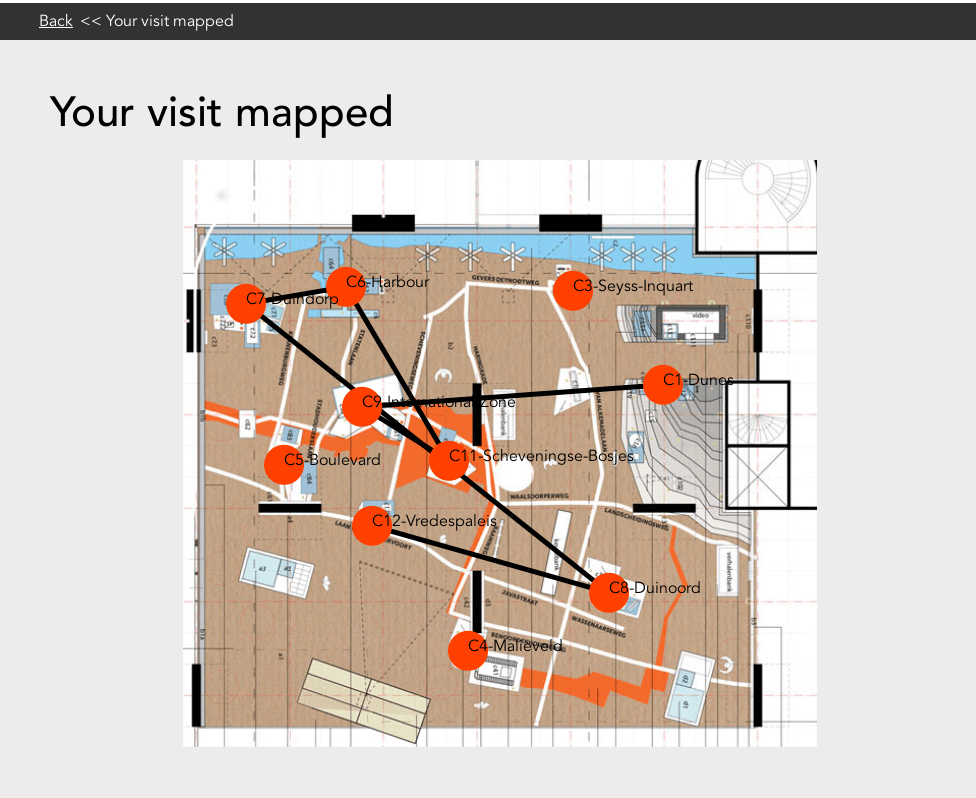
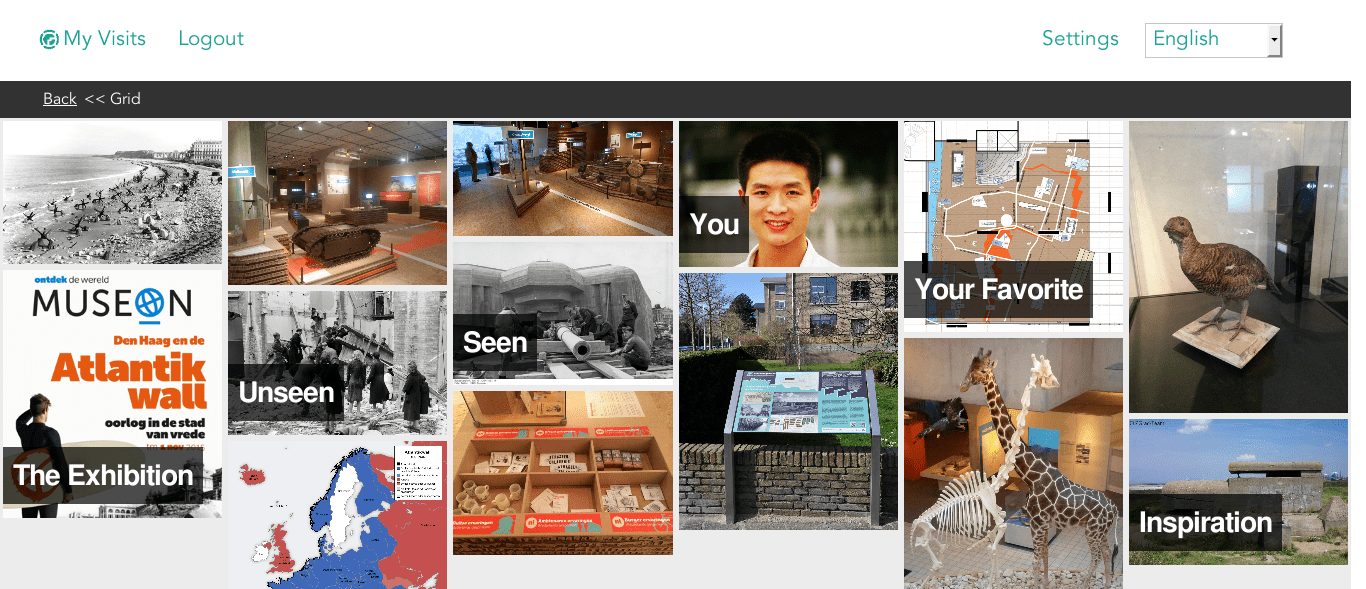
This post looks at the eighth of the visualization types created for the MeSch museum post-visit visualization tool. 
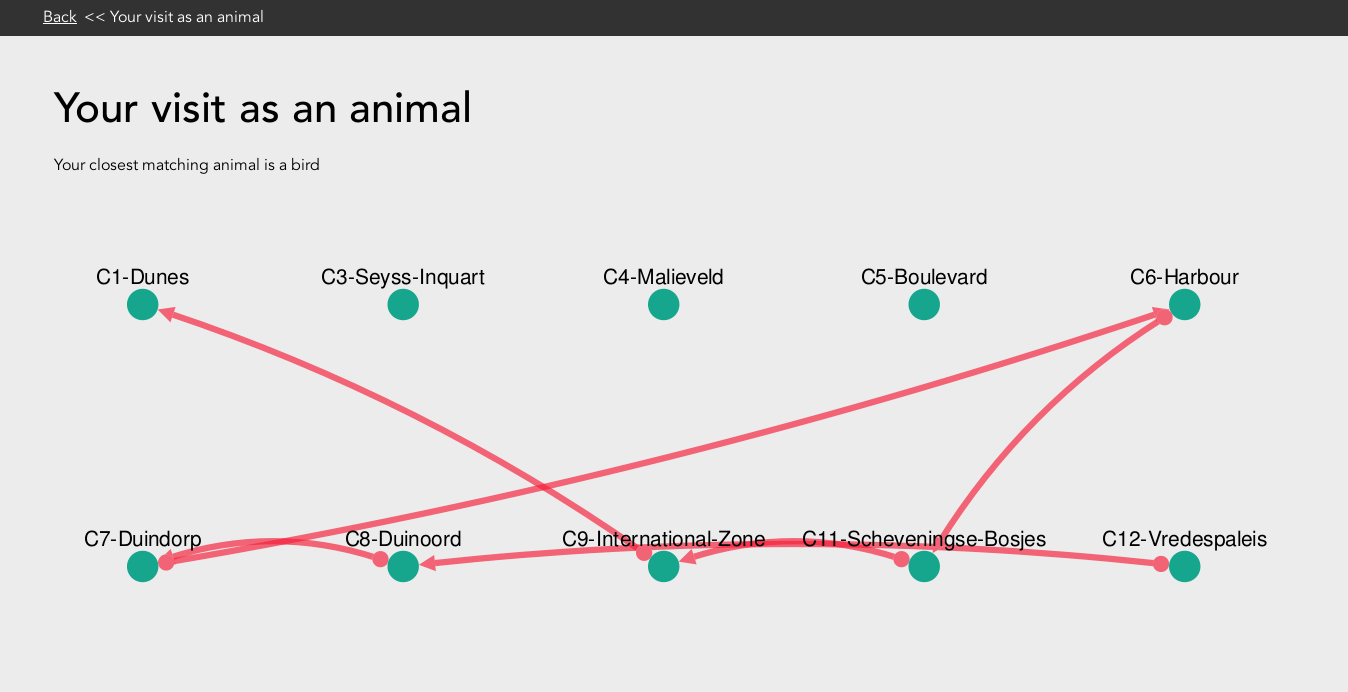
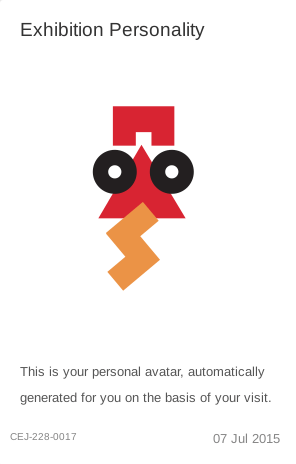
Click here for overview. This visualisation is loosely based around a French paper; Veron, E., Levasseur, M.: Ethnographie de l’exposition, Paris, Bibliothèque Publique d’Information, Centre Georges Pompidou. This Ethnographic study proposed that visitors movements in a museum could be compared to the behaviour of four "typical" animals. They used observational techniques to classify visitors as ANT, FISH, BUTTERFLY or GRASSHOPPER. For meSch we wanted to experiment with this idea and consider how such roles could be assigned to visitors using computational methods applied to the visitors log.
Map of Atlantic Wall Exhibition in The Hague with a visitors path superimposed
CodeData VisualizationsResearch

Map Visualisation

This post looks at the seventh of the visualisation types created for the meSch museum post-visit website: the Map Visualisation. Click here if you are looking for an overview of the meSch museum post-visit website. This map is a combination of static and dynamic content. The background layer is uploaded and configured by the curator. The curator must upload a background map image and drag the points of interest to the appropriate locations on the map. Once the curator is happy with their basic map they can flag the visualisation as "public".
museum visit timeline visualisation
CodeData VisualizationsResearch

Timeline Visualisation

This post looks at the fifth and sixth of the visualization types created for the MeSch museum post-visit visualization tool. Click here for overview. On the meSch platform there are two versions of timeline visualisation for the user to experience.
Museum visit grid visualisation is a series of images in a grid that each provide a gateway to additional information on the user visit
CodeData VisualizationsResearch

Grid Visualisation

This is the third of a series of posts looking at each of the different visualization types created for the MeSch museum post-visit visualization tool. Click here for the overview. This experimental visualisation was inspired by a page on the Wonderkamers website (which has since been moved to the Kunst museum and updated)
Abstract visualisation of a users visit showing a face at the centre surrounded by a series of circles
CodeData VisualizationsResearch

Bubbles Visualisation

This is the fourth of a series of posts looking at each of the different visualization types created for the MeSch museum post-visit visualization tool. Click here for overview. The bubbles visualisation is an abstract interactive illustration. A personalised character (similar to the personalised character detailed here) sits at the centre of a number of rings of bubbles (discs). The number of rings is determined by how many perspectives were available at the physical exhibition. For example at the Atlantikwall exhibition in Museon in Den Haag it was possible to experience the offering from one of 3 perspective; a German soldier, a civilian and/or a civil servant. Therefore the bubbles visualisation for this will have 3 rings of bubbles.
Word Cloud Visualisation
CodeData VisualizationsResearch

Word Cloud Visualisation

This is the second of a series of posts looking at each of the different visualization types created for the MeSch museum post-visit visualization tool. Click here for overview. Continuing the exploration of these visualizations we now look at the word cloud visualisation. The general concept of a word cloud visualisation is nothing particularly novel. As such it is a familiar way for users to interact with a site. The word cloud gives greater prominence to words that appear more frequently in the source. For this particular implementation the text content that the visitor is exposed to during their physical visit is used as the source. Using only the content from the points of interest that the visitor experienced the text is split into an array of words, word frequency is counted, certain words are filtered out and the remaining are displayed in the word cloud.
Personalised avatar - museum visit visualisation
CodeData VisualizationsResearch

Personalized avatar using svg.js

This is the first of a series of posts looking at each of the different visualization types created for the MeSch museum post-visit visualization tool. Click here for overview. Each museum visitor can get a postcard with a 11 character string in the format ABC-123-1234. This string is their unique passcode and can be used to access the digital post-visit visualization tool and view further information about their physical visit. One of the many visualizations developed for this online platform is the somewhat abstract SVG character visualization. A unique and personalised character to playfully represent the visitor. This specific idea was proposed by a group of Sheffield Hallam University students tasked with coming up with various ways of representing museum visitors visit visually.
Art Journal – What makes a house a home
ArtJournalingMaking

Art Journal – What makes a house a home

What makes a house a home? Is it a nice set of curtains? Is it designer furniture? Is it having the biggest TV and hottest new technology? Having lived in 14 houses so far I know that none of the above are what make a house a home for me. As part of her PhD my colleague Caro Claisse designed a kit, including a blank build-it-yourself laser cut house, to act as a canvas for people to express what makes a house a home for them.