This is the second of a series of posts looking at each of the different visualization types created for the MeSch museum post-visit visualization tool. Click here for overview.
Continuing the exploration of these visualizations we now look at the word cloud visualisation.
The general concept of a word cloud visualisation is nothing particularly novel. As such it is a familiar way for users to interact with a site. The word cloud gives greater prominence to words that appear more frequently in the source. For this particular implementation the text content that the visitor is exposed to during their physical visit is used as the source. Using only the content from the points of interest that the visitor experienced the text is split into an array of words, word frequency is counted, certain words are filtered out and the remaining are displayed in the word cloud.
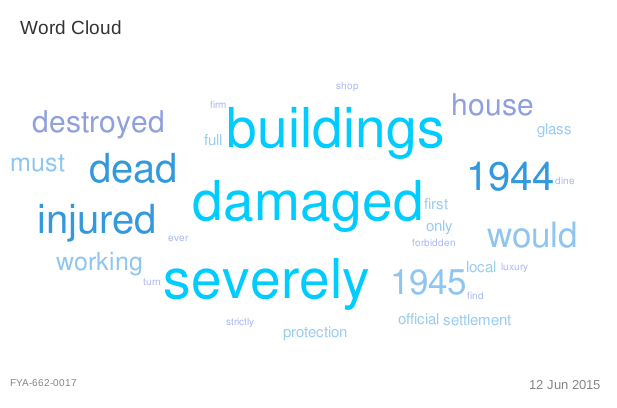
Word cloud for user visiting the Atlantikwall exhibition at Museon, Den Haag, The Netherlands in English.
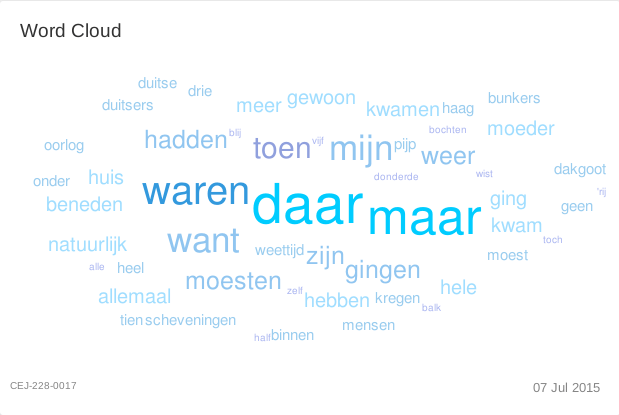
Word cloud for user visiting the Atlantikwall exhibition at Museon, Den Haag, The Netherlands in Dutch.
This visualisation was tested in English, Dutch and Italian.
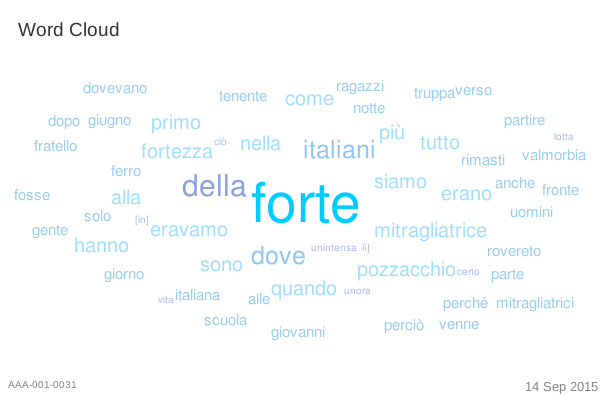
Word cloud for user visiting the Forte Pozzacchio exhibition in Rovereto, Italy in Italian.
This implementation relies on the jQuery plugin jQCloud for layout. Code for the meSch implementation can be found on bitbucket here