This post looks at the fifth and sixth of the visualization types created for the MeSch museum post-visit visualization tool. Click here for overview.
On the meSch platform there are two versions of timeline visualisation for the user to experience.
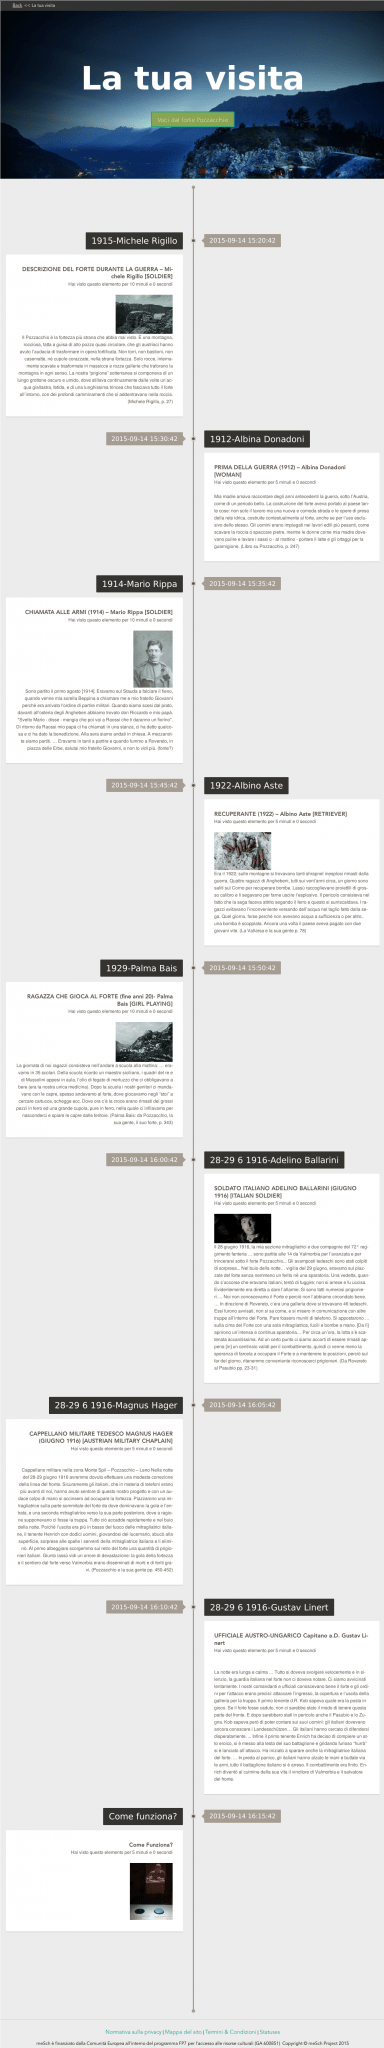
The first is the user visit visualisation. This presents the user with a direct reminder of the items they have personally seen during their physical visit. A vertical line takes the visitor to each of the points of interest they experienced, in the order and language they experienced them, re-introducing them to the content they would have seen/heard on site.
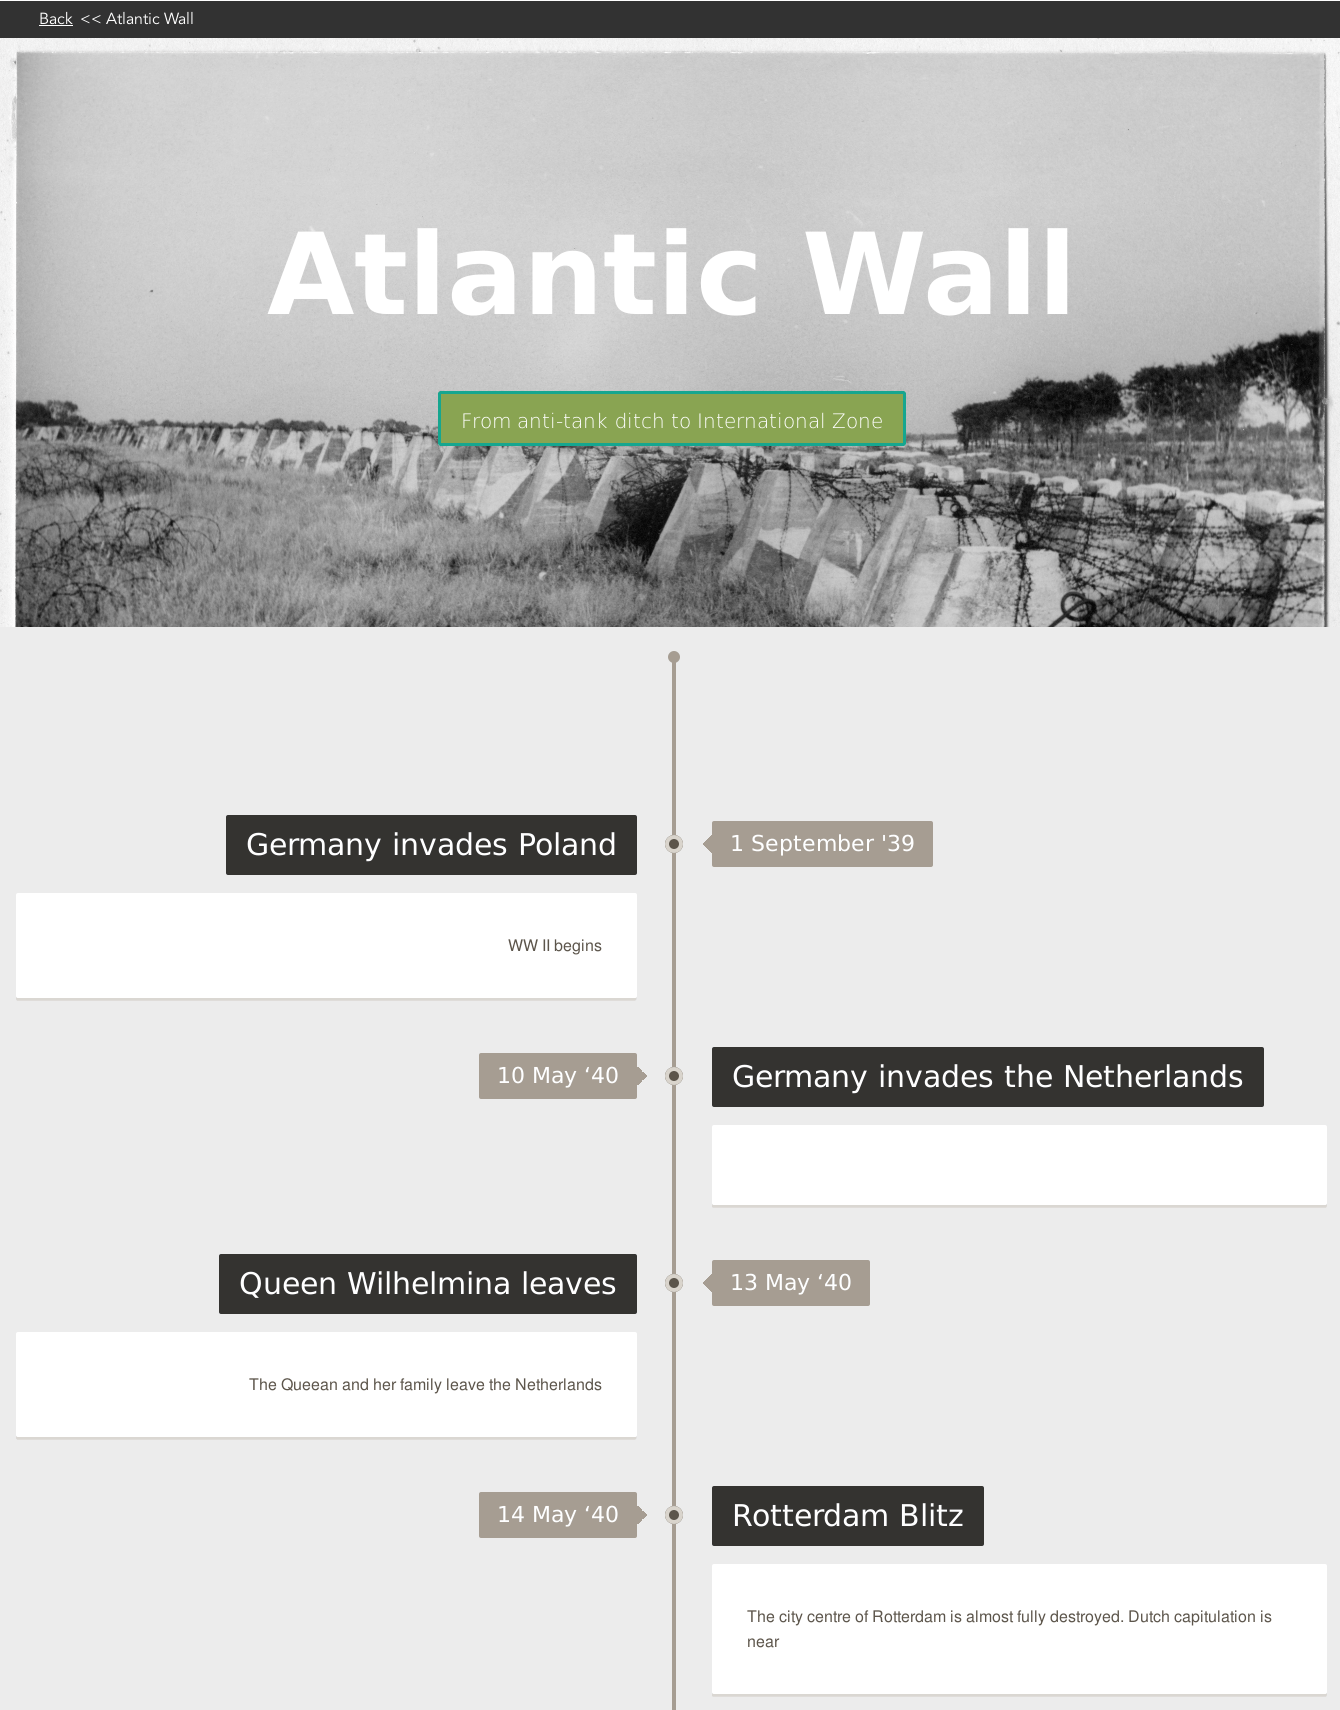
The second is the static curator timeline. The curator creates and modifies the content (text and images) for the visualisation through a curator only GUI tool. When the visitor views the visualisation they are shown what the curator wants to show, in the order decided by the curator. In this case each user is exposed to exactly the same data.
 The code for both implementations is very similar. The main difference is the source of the data displayed. The user visit information comes from a series of API’s linking the user visit log to content from the exhibition model. The curator static timeline requires that the curator create and modify the visualisation on the visualisation tool before it can be displayed.
Code for this visualisation can be found on bitbucket here, here and here with css here.