This post looks at the eighth of the visualization types created for the MeSch museum post-visit visualization tool. Click here for overview.
This visualisation is loosely based around a French paper; Veron, E., Levasseur, M.: Ethnographie de l’exposition, Paris, Bibliothèque Publique d’Information, Centre Georges Pompidou.
This Ethnographic study proposed that visitors movements in a museum could be compared to the behaviour of four “typical” animals. They used observational techniques to classify visitors as ANT, FISH, BUTTERFLY or GRASSHOPPER.
For meSch we wanted to experiment with this idea and consider how such roles could be assigned to visitors using computational methods applied to the visitors log.
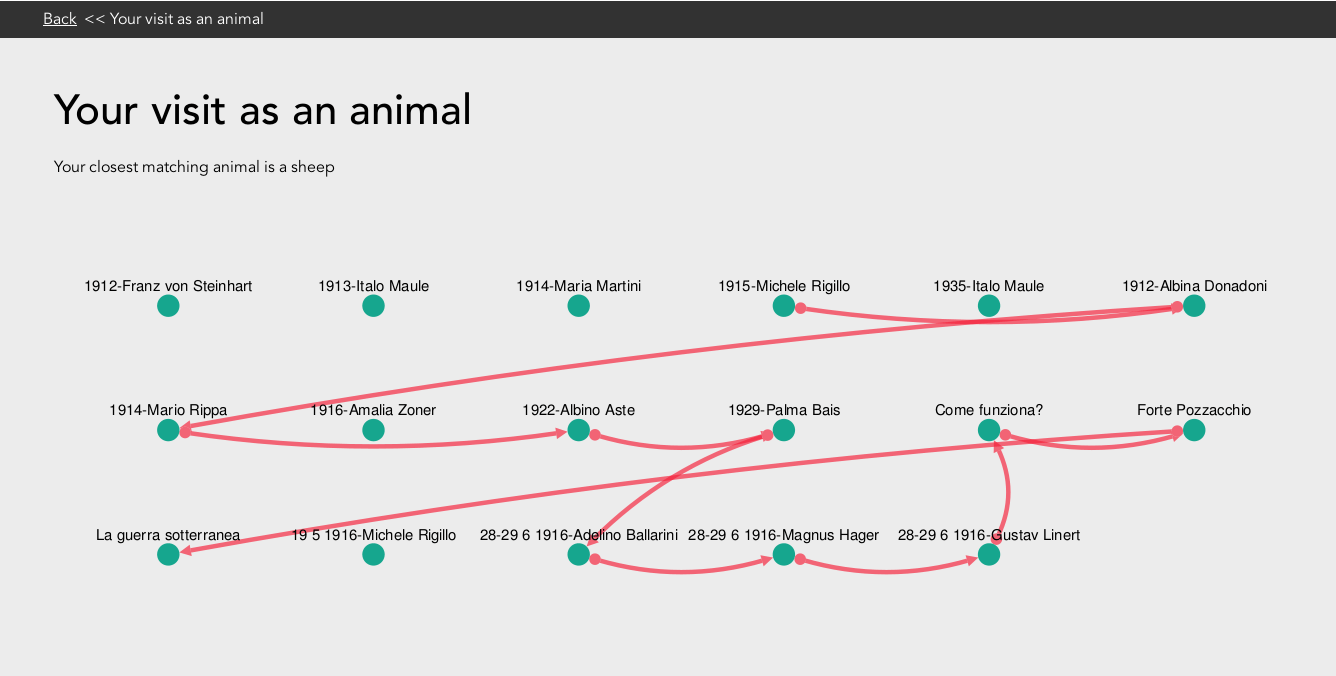
User animal path visualisation for visitor to Forte Pozzacchio exhibition in Rovereto, Italy
A random collection of 5 animals was chosen; A fish, a sheep, a bird, an iguana and a panda. Each animal was assigned an array of expected values for each of a set of calculable results. The three statistics considered the most useful and easiest to extrapolate for a single visitor given our available logs were
- The average time the visitor spent with the points of interest they experienced.
- The percentage of points experienced by the visitor.
- The percentage of available content consumed by the visitor.
When the user visits the website, their physical visit logs are pulled down via API, the above calculations are made and the visitor is assigned an animal based on which animal has the closest similar values.
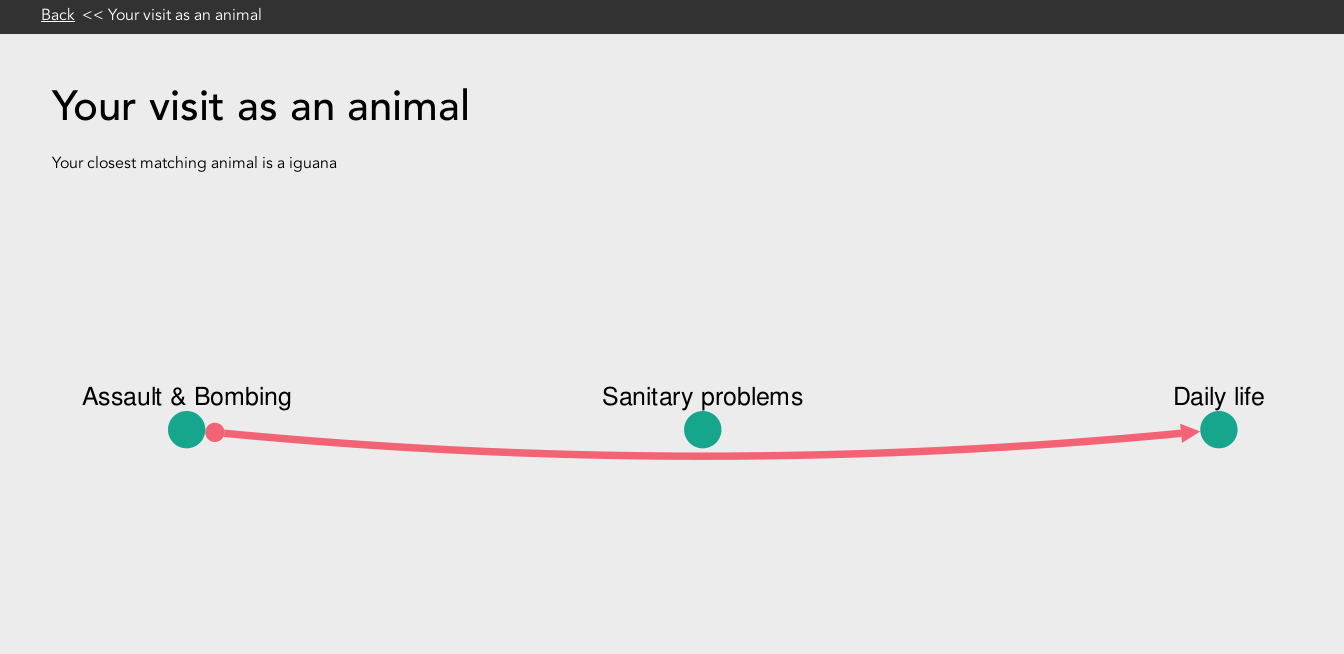
User animal path visualisation for demo exhibition Views on WWI
Using cytoscape.js all of the points of interest in an exhibition are displayed with lines shown to illustrate the path the user took between these various points. For all of the theory involved, the visual presentation of this idea is still quite basic but has great scope for improvement. Possible future improvements could be adding an image of the users animal, changing the users path from red lines into a path of animal paw prints. Potentially any animal representation could then be further personalised programmatically e.g. to have bigger eyes if they have seen more points or to displayed with accessories depending on the type of exhibition being modelled.
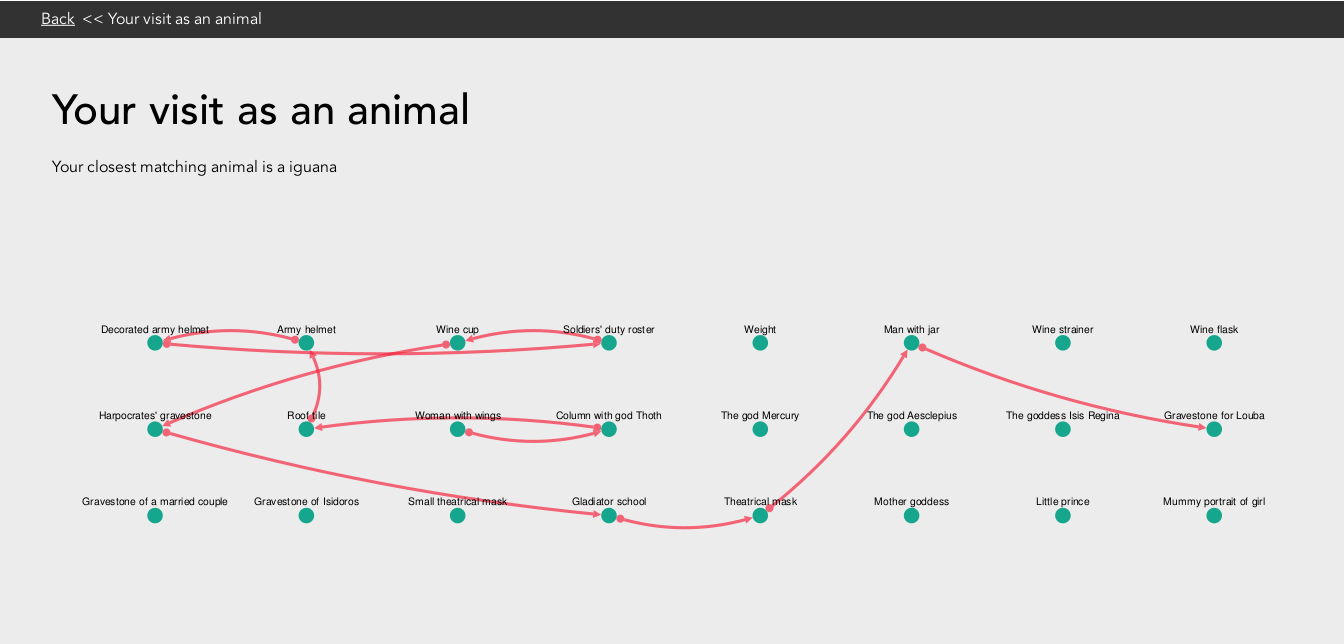
Animal path visualisation for visitor to Keys To Rome exhibition at Allard Pierson Museum, Amsterdam, The Netherlands.
In its current state this visualisation depends on the JavaScript library cytoscape.js . Code is available on bitbucket here and here.