Tech
Magazine Visualisation
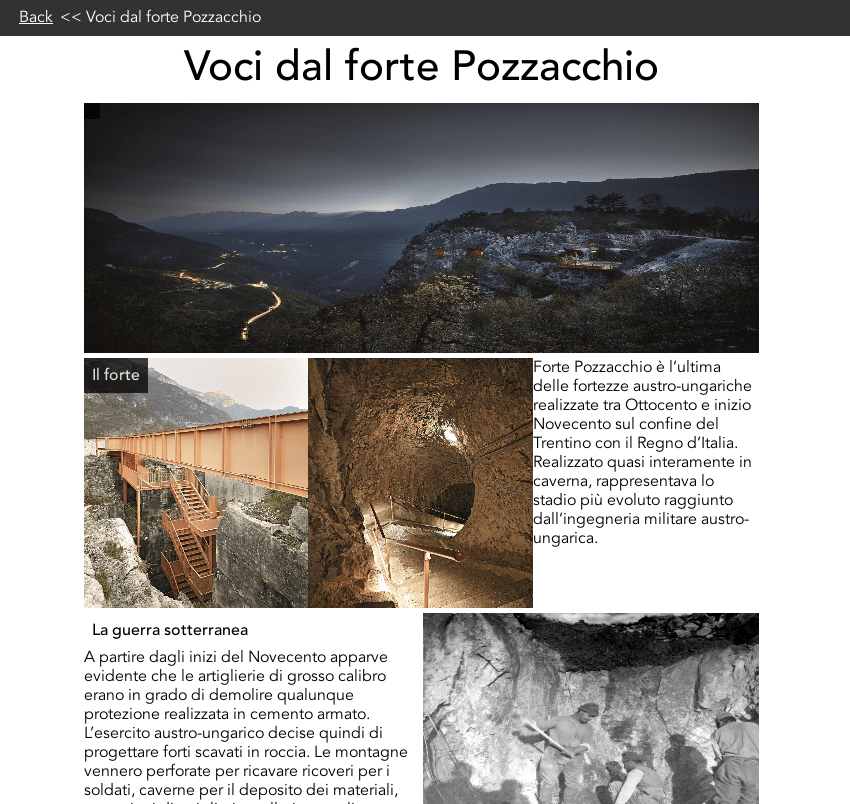
One of the outputs for the EU funded meSch project was a visualisation website. The Magazine Visualisation is one of the visualisations available on the meSch Post Visit Website. For information on how the meSch Post Visit Website works click here. The Curators at Museo della Guerra frequently create custom paper magazines to go with their exhibitions. Any exhibition might have multiple booklets, on different aspects of the same subject. For example, for an exhibition on WWI they might have 3 different books; the first on sanitary conditions, a second on daily fife and a third on the assault & bombing.
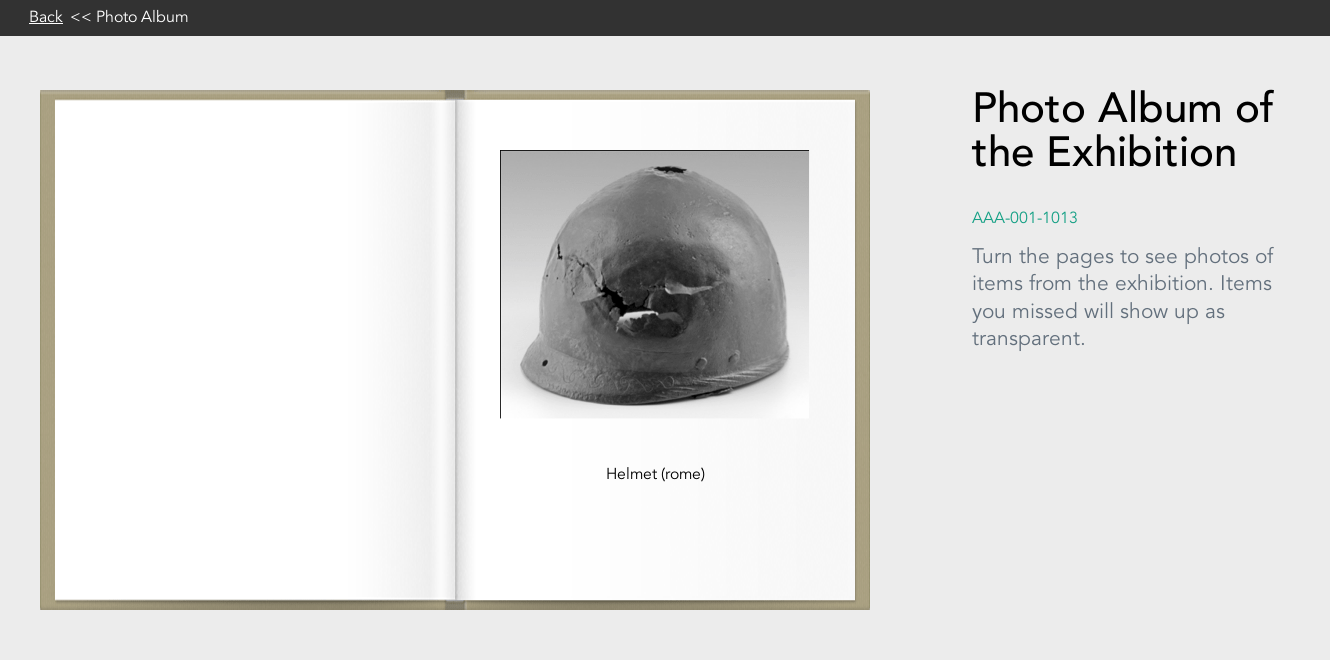
Photo Album Visualisation
One of the outputs for the EU funded meSch project was a visualisation website. The Photo Album Visualisation is one of the visualisations available on the meSch Post Visit Website. For information on how the meSch Post Visit Website works click here. In short, during the physical visit the visitor checks-in at various exhibits using a physical item with an RFID card in it. The RFID logs the visit to a database. At the end of the visit the user gets a unique id, for example in the form of a printed postcard. They can use this ID to log in to the meSch Post Visit Website and see various visualisations based on their visit. This visualisation is a simple photo album. This visualisation is based on the HTML5 canvas flip book demo 20 Things I Learned. Each point of interest for the museum exhibition will have an image associated with it. This book displays all of these images and their titles.
Passbook Visualisation
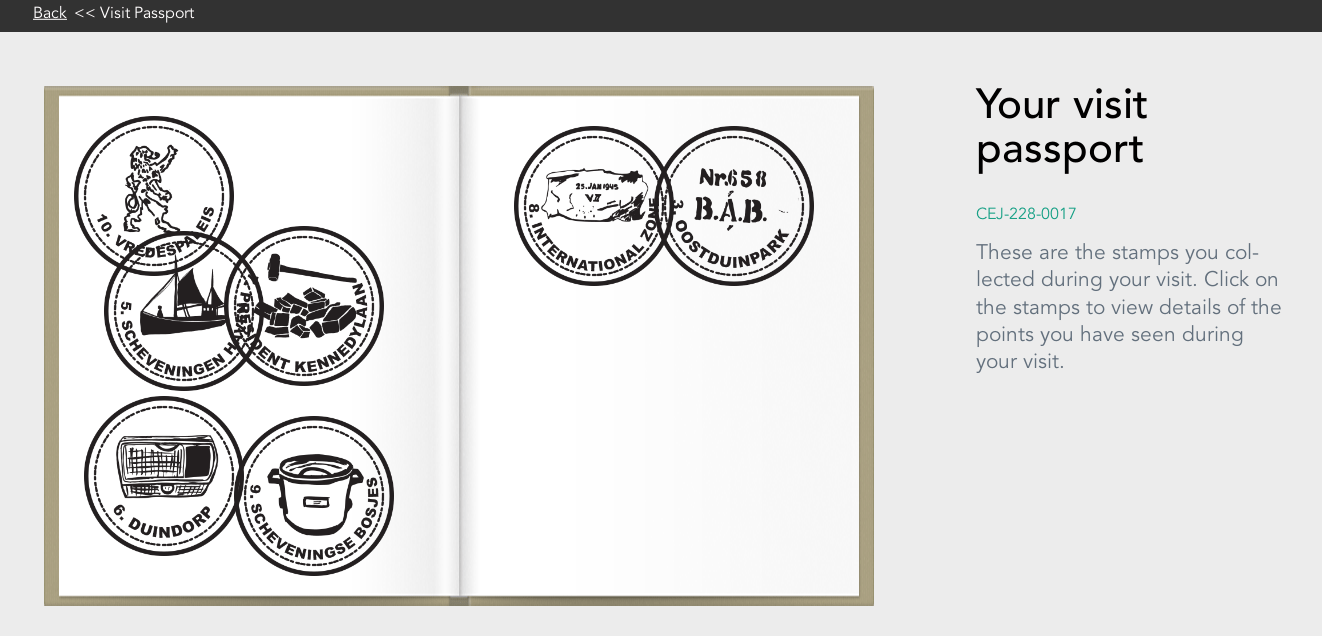
This post looks at the tenth of the visualization types created for the MeSch museum post-visit visualization tool. Click here for overview. This visualisation was created exclusively for the Atlantikwall exhibition based on the stamps used on the physical postcard that exhibition visitors received.
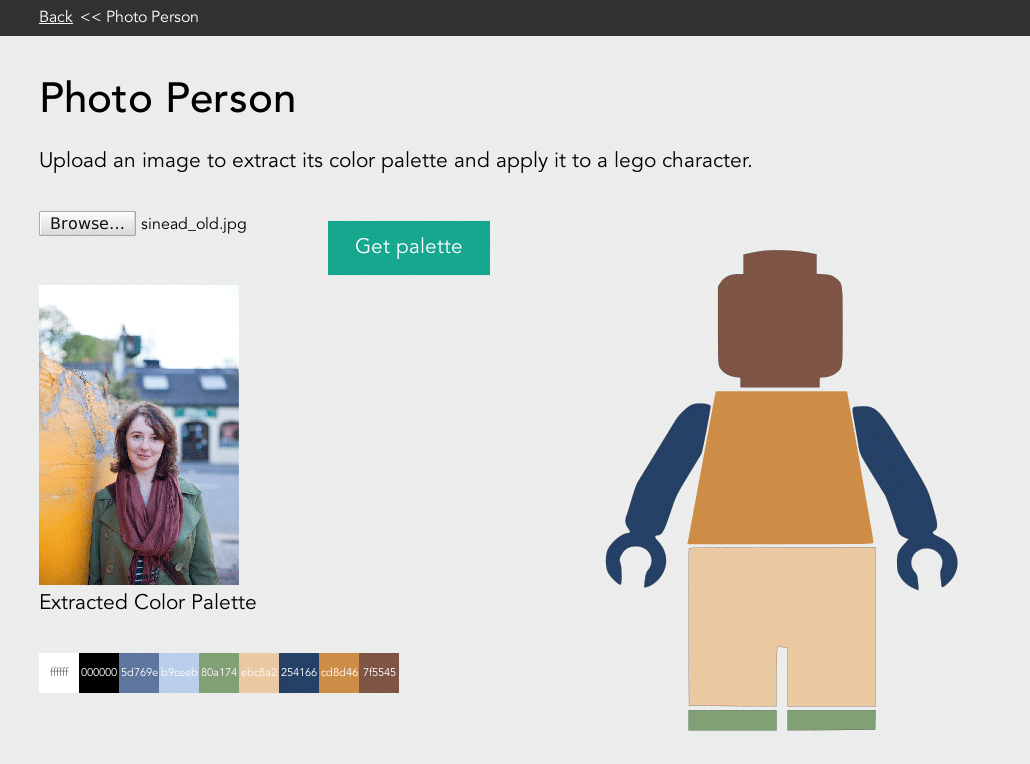
Personalised Lego Character from Photo
This post looks at the ninth of the visualization types created for the MeSch museum post-visit visualization tool. Click here for overview. While investigating methods of creating personalised characters for online site users we explored the idea of using a photograph of a person to act as the basis for a Lego person.
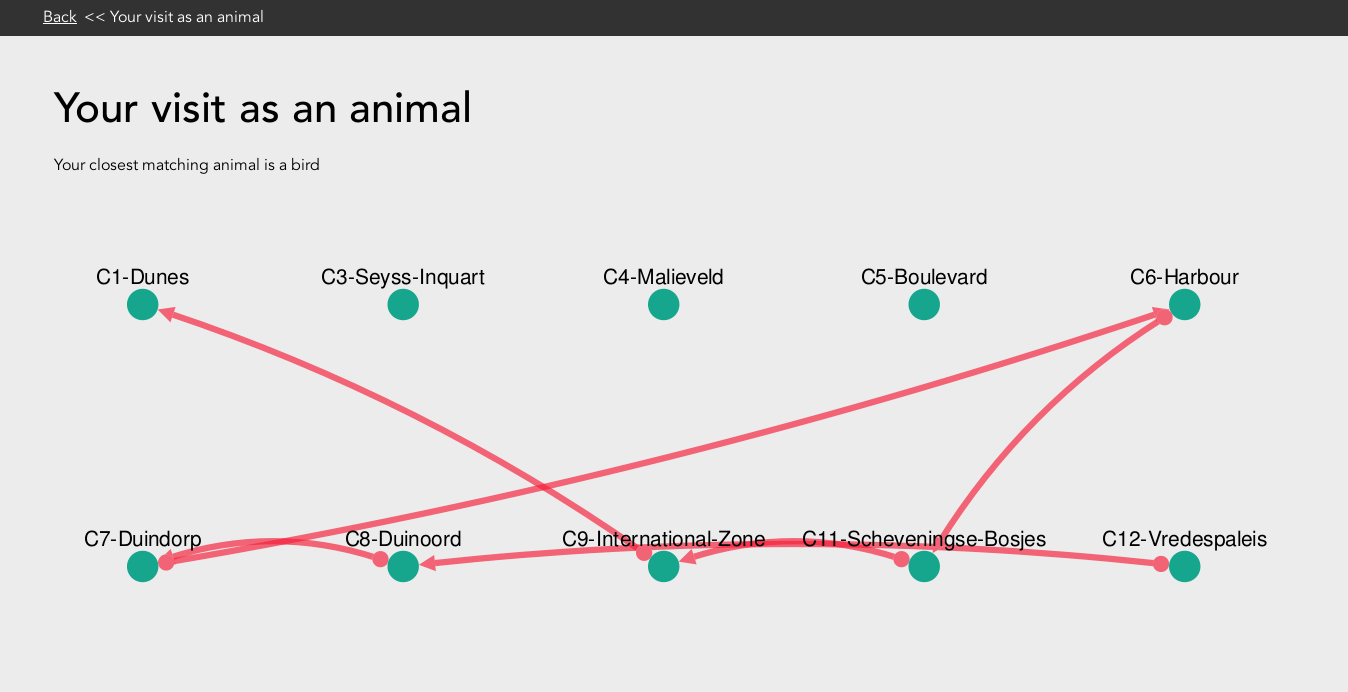
Animal Path Visualisation
This post looks at the eighth of the visualization types created for the MeSch museum post-visit visualization tool. Click here for overview. This visualisation is loosely based around a French paper; Veron, E., Levasseur, M.: Ethnographie de l’exposition, Paris, Bibliothèque Publique d’Information, Centre Georges Pompidou. This Ethnographic study proposed that visitors movements in a museum could be compared to the behaviour of four "typical" animals. They used observational techniques to classify visitors as ANT, FISH, BUTTERFLY or GRASSHOPPER. For meSch we wanted to experiment with this idea and consider how such roles could be assigned to visitors using computational methods applied to the visitors log.
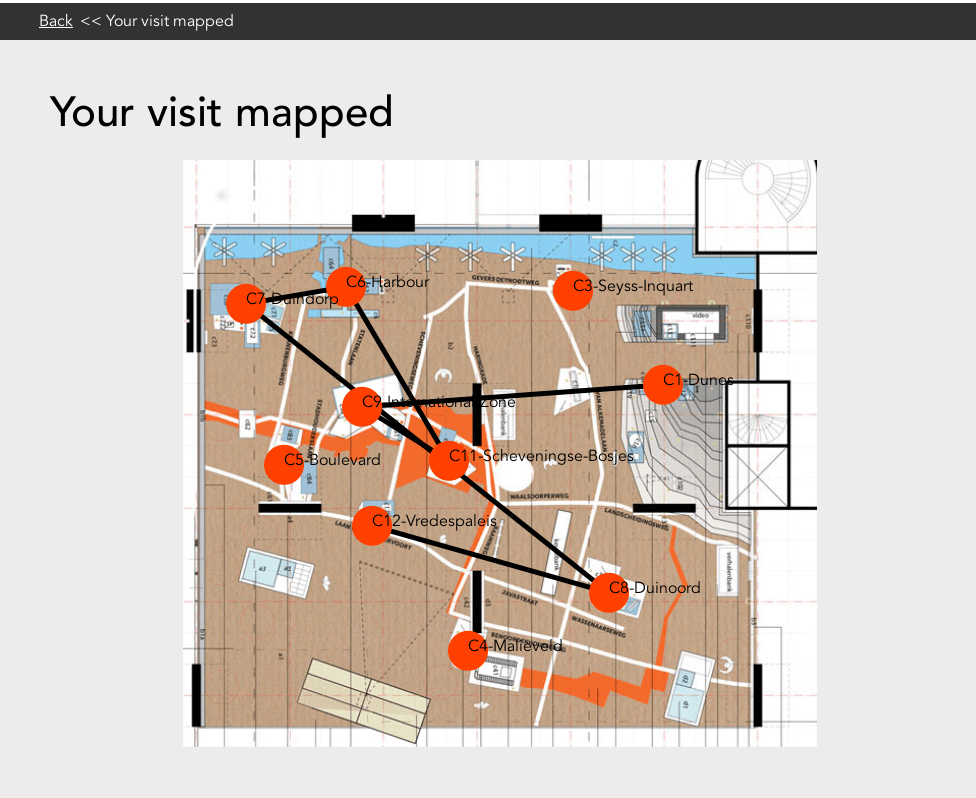
Map Visualisation
This post looks at the seventh of the visualisation types created for the meSch museum post-visit website: the Map Visualisation. Click here if you are looking for an overview of the meSch museum post-visit website. This map is a combination of static and dynamic content. The background layer is uploaded and configured by the curator. The curator must upload a background map image and drag the points of interest to the appropriate locations on the map. Once the curator is happy with their basic map they can flag the visualisation as "public".
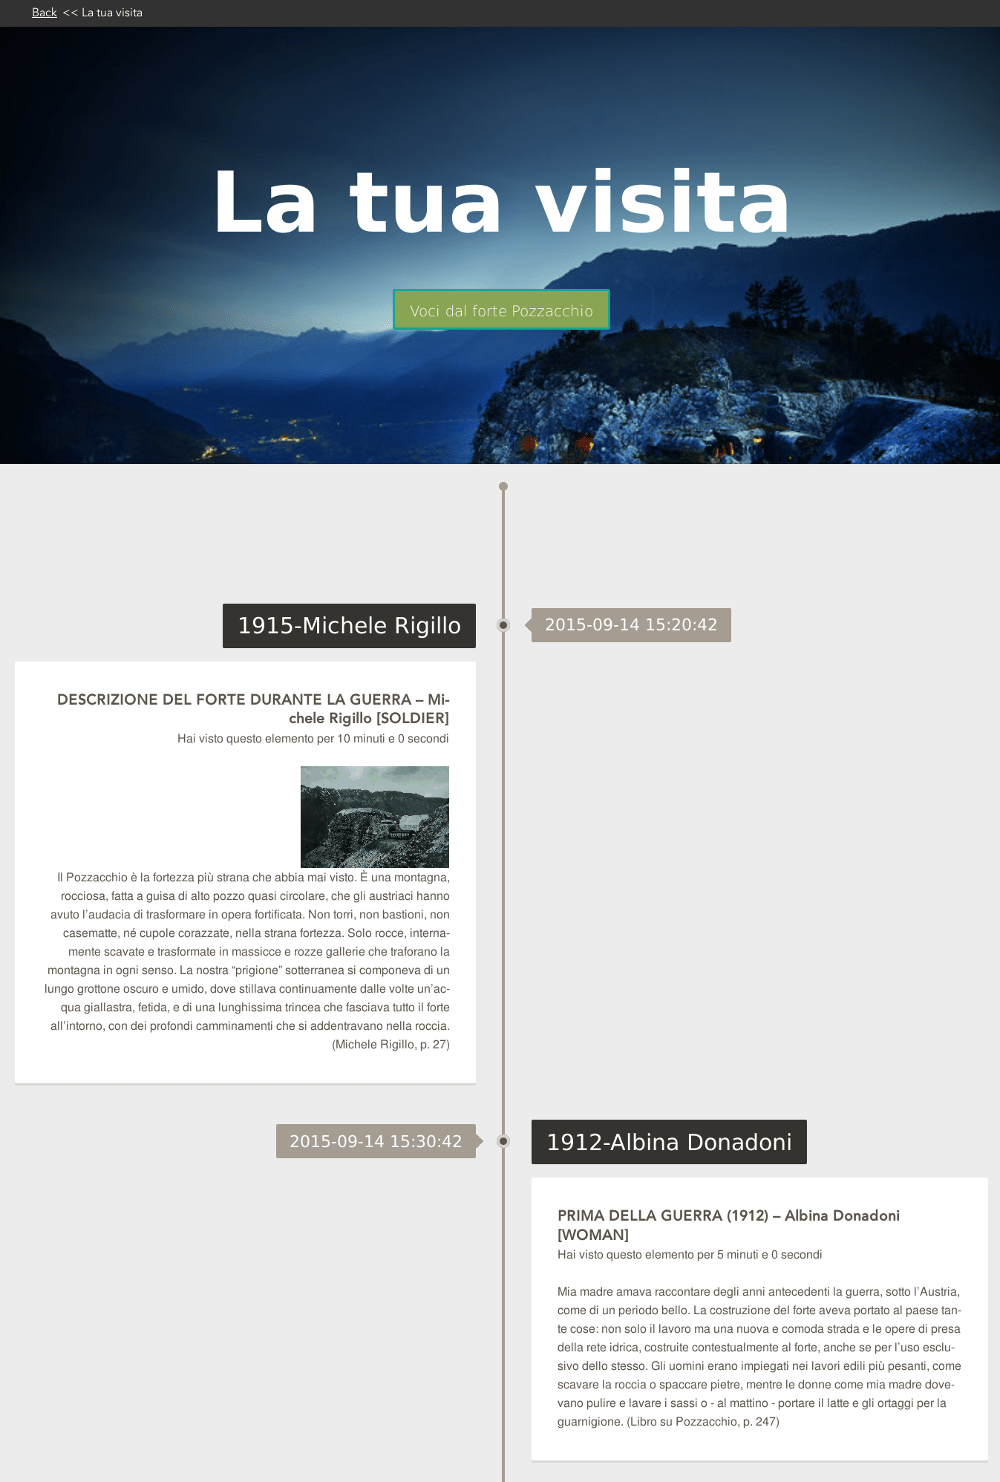
Timeline Visualisation
This post looks at the fifth and sixth of the visualization types created for the MeSch museum post-visit visualization tool. Click here for overview. On the meSch platform there are two versions of timeline visualisation for the user to experience.
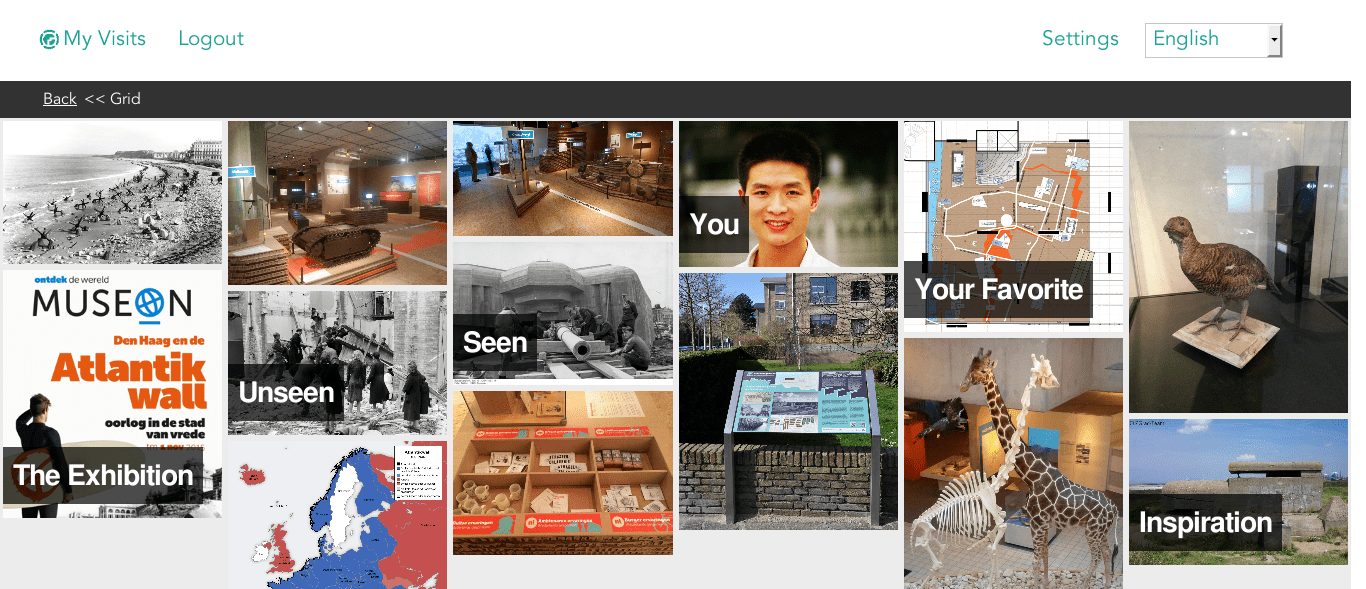
Grid Visualisation
This is the third of a series of posts looking at each of the different visualization types created for the MeSch museum post-visit visualization tool. Click here for the overview. This experimental visualisation was inspired by a page on the Wonderkamers website (which has since been moved to the Kunst museum and updated)
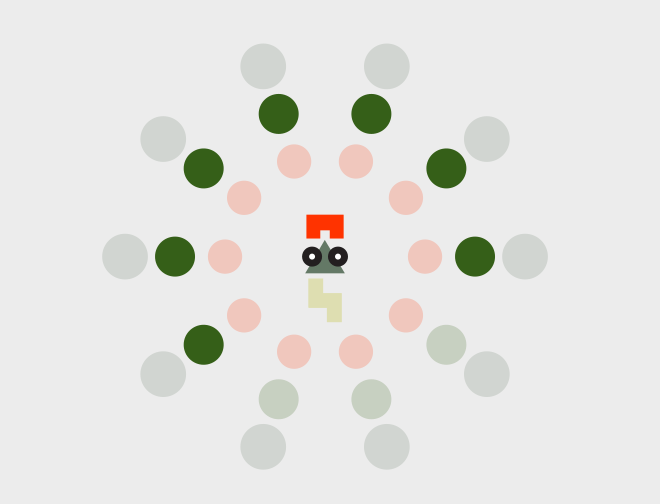
Bubbles Visualisation
This is the fourth of a series of posts looking at each of the different visualization types created for the MeSch museum post-visit visualization tool. Click here for overview. The bubbles visualisation is an abstract interactive illustration. A personalised character (similar to the personalised character detailed here) sits at the centre of a number of rings of bubbles (discs). The number of rings is determined by how many perspectives were available at the physical exhibition. For example at the Atlantikwall exhibition in Museon in Den Haag it was possible to experience the offering from one of 3 perspective; a German soldier, a civilian and/or a civil servant. Therefore the bubbles visualisation for this will have 3 rings of bubbles.
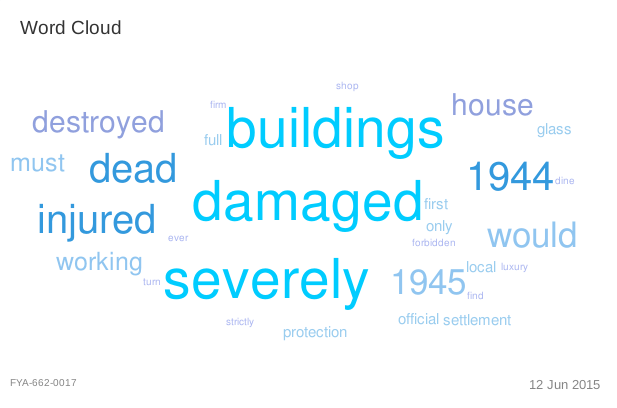
Word Cloud Visualisation
This is the second of a series of posts looking at each of the different visualization types created for the MeSch museum post-visit visualization tool. Click here for overview. Continuing the exploration of these visualizations we now look at the word cloud visualisation. The general concept of a word cloud visualisation is nothing particularly novel. As such it is a familiar way for users to interact with a site. The word cloud gives greater prominence to words that appear more frequently in the source. For this particular implementation the text content that the visitor is exposed to during their physical visit is used as the source. Using only the content from the points of interest that the visitor experienced the text is split into an array of words, word frequency is counted, certain words are filtered out and the remaining are displayed in the word cloud.
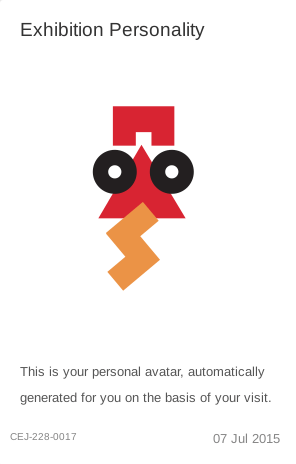
Personalized avatar using svg.js
This is the first of a series of posts looking at each of the different visualization types created for the MeSch museum post-visit visualization tool. Click here for overview. Each museum visitor can get a postcard with a 11 character string in the format ABC-123-1234. This string is their unique passcode and can be used to access the digital post-visit visualization tool and view further information about their physical visit. One of the many visualizations developed for this online platform is the somewhat abstract SVG character visualization. A unique and personalised character to playfully represent the visitor. This specific idea was proposed by a group of Sheffield Hallam University students tasked with coming up with various ways of representing museum visitors visit visually.
Atlantic Wall post-visit website
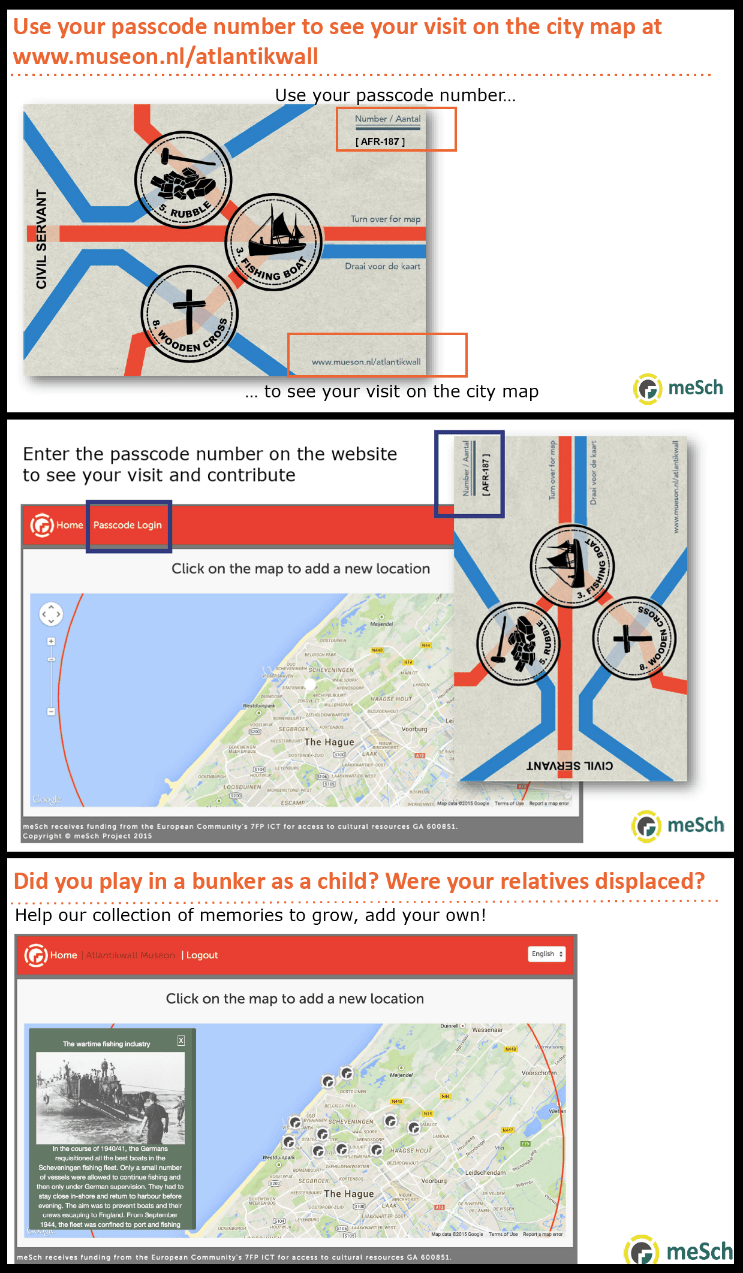
“The Hague and the Atlantic Wall: War in the City of Peace” was a museum exhibition which ran from April to October in 2015 at Museon in the city of The Hague, in The Netherlands. The Atlantic Wall was a set of the defensive lines and placements that were built by the German forces during WWII along the coast of the Atlantic Ocean and North Sea, from Norway to the French/Spanish border. The wall consisted of a 5,000 km long chain of bunkers, anti-tank walls, cliffs and other barriers and was aimed at preventing an Allied attack on the Reich’s Western frontiers. This exhibition focused specifically on the Atlantic Wall in The Hague and the impact of its construction on the city and its inhabitants. Visitors were tracked as they interacted with the exhibition and once they had completed their visit they could visit a checkout point and print themselves a personalized visit souvenir postcard.
meSch Post Visit Website
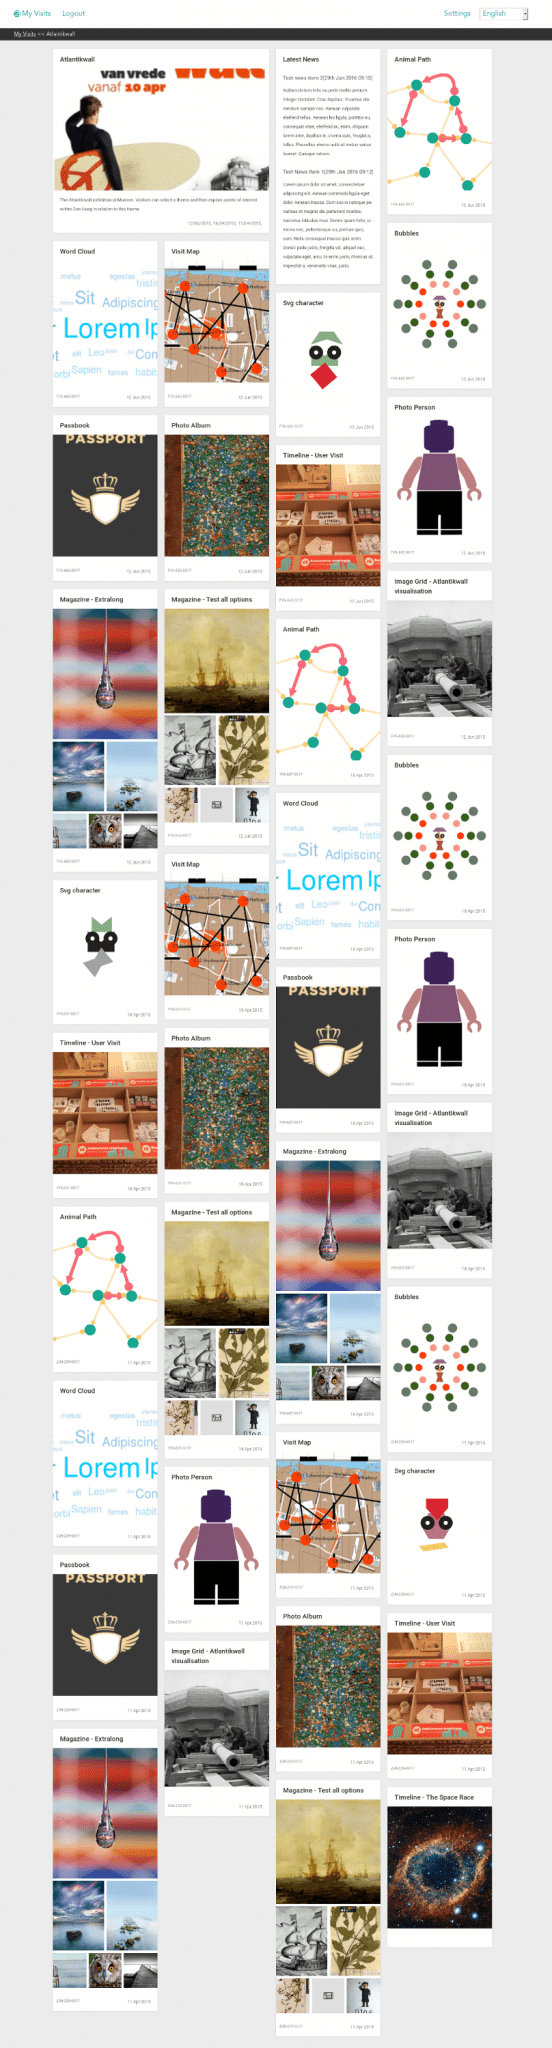
Introduction
The idea of allowing users to extend their visit is very popular with Museum officials at present. The meSch post-visit visualization tool was designed to explore how elements from an exhibition could be combined with information from a users visit to provide a personalized hyper-visual interface. The hope being it would allow the visitor: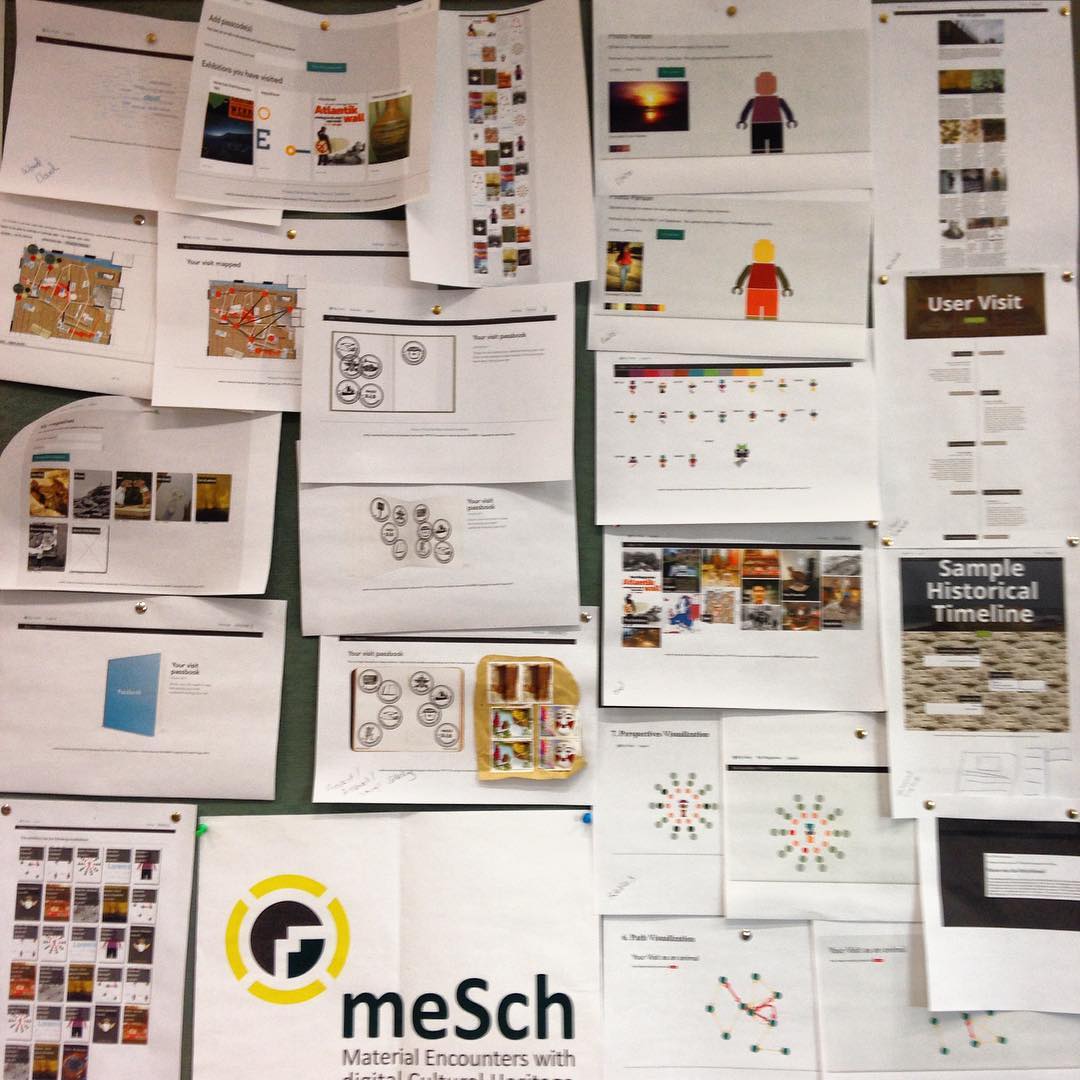
From Instagram: Trying to find a way to put all this in words. #mesch #visualisation #postvisit
Post museum visit visualisations. This image has been automagically pulled from my Instagram feed here